
We believe in great partnerships. Together with Printix we at Ironstone have created a free Power BI Dashboard available to all partners of Printix, that will add more value for all businesses using the cloud management solution.
About the project
Together with Printix we have created an open source code for Power BI for partners of Printix to use. It enables their customers to get an overview of stats like usage, printers and users. The project is available on GitHub. Currently, the project can be used by Printix partners. The purpose of the project is for partners to test and contribute to the further development and improvement of the product.
“We like being first and so do Ironstone, so we immediately said yes to partnering with them on this Power BI project. To my knowledge, Printix is the only cloud print solution leveraging real-time monitoring which is presented through a highly customizable dashboard driven by Microsoft Power BI.” - Printix's Senior Marketing Manager, Craig Parrish.
"We strongly believe in pro-active partnerships with our customers and partners. A key differentiator for Ironstone is to provide completely transparent and automated documentation and analytics for our customers. This project builds perfectly on our current documentation and analytics platform. It gives our customers key insights into their own print usage." - Ironstone's Cloud Offering Manager & Solution Architect, Morten Reinhardtsen.
How it works for our customers
We have already started to test it out for some of our customers, and it is providing them with valuable insights into their print usage. There are statistics for users, printers, workstations, print queues, locations and historic data. This provides our customers with a better control over usage and cost.
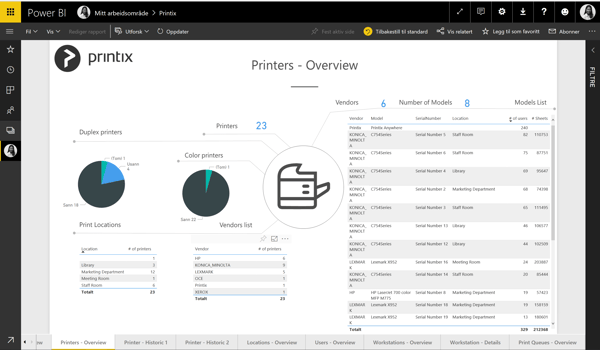 llustration: Overview of the ‘Printers overview’ report
The project provides many stats and functions. Here are some of the useful data you can analyze.
- Locations – provides you with the information on all your printers, even if they are spread over different offices. Here you can extract information on how much each printer is used and which ones are not worth having.
- Toners - shows you how much toner and which type that has been used in the set time range. This can in the long run help you see what kind of toners you should buy and when you can expect to have to change the different toners.
- Errors - gives our customers a better insight into how much service is required. If you have a service agreement maintaining the printers, you can easily ensure that your service provider follows up all the issues.
How do you get this?
At this stage the project is directed towards partners. That means that you need to be a customer of a Printix partner. If you are a qualified partner, please contact Printix for further information.
“We are now able to provide Printix partners with detailed insight into their customers’ print infrastructure, which gives them the opportunity to be pro-active service providers based on real-time data,” - Printix’s Partner Manager in EMEA, Damien Roberts.
Link: Contact Printix
We truly believe in great partnerships; this project is the proof that we can create some great results when we combine each other’s strengths. We are looking forward to following the ongoing development of the project!